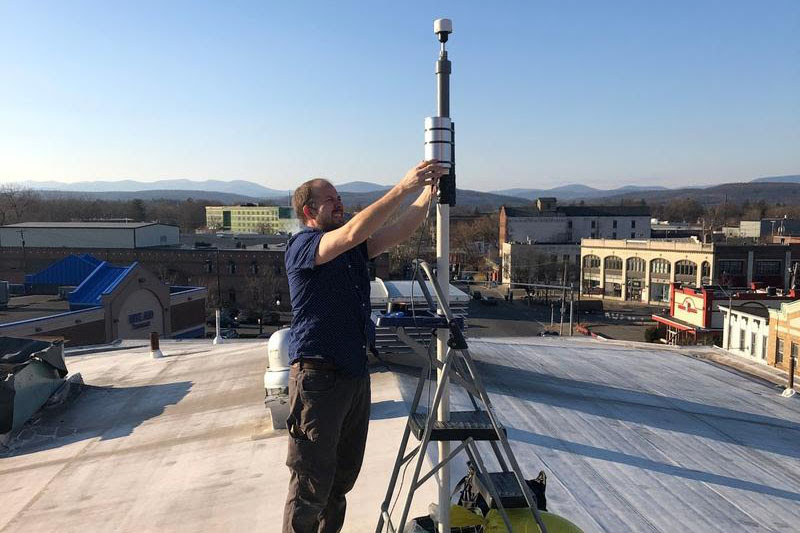
Dr. Eli Dueker installs a MetOne 212-2 particle profiler atop the Andy Murphy Neighborhood Center, Midtown Kingston. Courtesy City Of Kingston
Bard College’s Center for the Environment Sciences and Humanities (CeESH) is pleased to announce the Kingston Air Quality Initiative’s (KAQI), after two years of research and data collection. Also, a new dashboard has been made available so that Kingston residents can access real-time air quality information.
KAQI began in January 2020 as a partnership between Bard’s Community Science Lab and the City of Kingston Conservation Advisory Council’s Air Quality Subcommittee to conduct a first-ever Kingston-centered air quality study. Since then, Kingston residents, Bard College staff, students, and faculty have performed air quality monitoring in both indoor- and outdoor environments.
KAQI’s main monitoring efforts focus on a regional assessment of air pollution from fine particulate matter (PM2.5), as measured from the roof of the Andy Murphy Neighborhood Center on Broadway in Kingston. PM2.5 is composed of microscopic particles, which are the result of burning fuel. It is released into the atmosphere through exhausts from automobiles, oil burners, gasoline burners, cooking, grilling and both indoor and outside wood burning. Because PM 2.5 particles can be so small, they remain suspended in the air for long periods, allowing them long distances to travel before depositing. These particles can be inhaled and enter the bloodstream via the lungs. This can cause or worsen health problems. The World Health Organization (WHO) states that “Small particulate pollution has health impacts even at very low concentrations–indeed no threshold has been identified below which no damage to health is observed.”
After two full years of monitoring, KAQI found that while many signs point to Kingston’s overall air quality being decent, conditions do sometimes reach unhealthy levels for some individuals, and there is certainly room for improvement.
The annual mean standard and 24-hour average standards are two important measures of PM2.5 airquality. For the period of measurement, Kingston met both the Environmental Protection Agency’s (EPA) and the WHO’s annual mean standard. While the city was well below the EPA’s standard, it was much closer to the WHO’s stricter standard. For the 24-hour standard, Kingston met the EPA’s criteria, but was over the WHO’s 24-hour standard. For context, as of 2019, 99% of the world’s population was living in locations that do not meet the WHO’s air quality standards.
Long-term trends can only be evaluated on a multiyear time scale. These first two years of monitoring will provide a baseline for KAQI’s monitoring efforts in the next few years, and allow them to assess how Kingston particulate matter pollution levels are changing over time.
These findings and more can be viewed at the Center for the Environment Sciences and Humanities site: https://cesh.bard.edu/kingston-air-quality-initiative-kaqi/.
The Center for the Environment Sciences and Humanities at Bard College, in collaboration with KAQI, has developed a dashboard that allows Kingston residents to access real-time information about their city’s air quality. The current PM2.5 and PM10 conditions are shown and interpreted, and one can see the air quality sensor’s reading from the past 12 hours. You can view the hourly particulate matter readings for the entire Andy Murphy Neighborhood Center dataset.
The dashboard can be found here: https://tributary.shinyapps.io/AMNC_live/
“KAQI is an important model for ways that academic institutions can contribute concretely to the communities who surround and support them,” said Eli Dueker, Director of Bard’s Center for the Environment Sciences and Humanities. “We are combining serious efforts to monitor long-term air quality in Kingston with tools that allow us to put the data in front of residents in real time and give them feedback about what is going on in their city today.”
“This Kingston Air Quality Initiative monitoring project is such an important step that Kingston is taking toward assuring that its residents will breathe clean air into the future. This project responds to the need for both regional and neighborhood monitoring so that all residents’ air quality is taken into account. That the initiative focuses on PM 2.5 is especially important,” said Judith Enck, former EPA Regional Administrator.
Emily Flynn, City of Kingston Director of Health and Wellness, added “As we know, air quality can have significant impacts for respiratory infections, heart disease, stroke and lung cancer, and more severely affects people who are already ill. We applaud the work of the Center for Environmental Science and Humanities at Bard and thank them for their work here in Kingston.”
“Through the Kingston Air Quality Initiative dashboardThe Bard Center for the Environment Sciences and Humanities provides a valuable tool for the City of Kingston and its residents. It allows them to assess the health risks posed by pollution in real-time. The long-term trend data recorded will be a resource for decision makers to see the patterns of air quality within the city and to understand the impacts of local changes on air quality.” said Nick Hvozda, Interim Director of the Ulster County Department of the Environment. 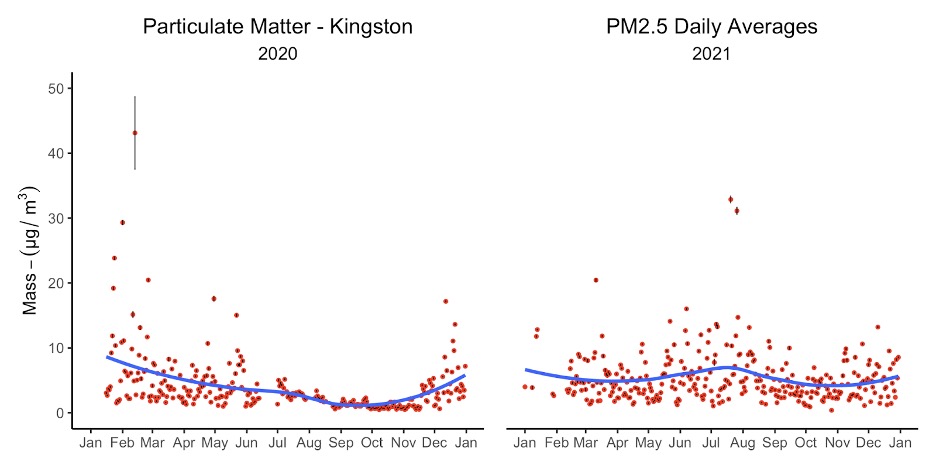
These figures show daily PM2.5 averages for 2020/2021. Each point represents a single day. Vertical lines indicate the range in hourly readings on that day. (If no vertical lines are visible, the variation was greater than the graphic point). The blue line is a smoothing line that gives an indication of seasonal trends.
Visit www.implement.org for more information. https://kingston-ny.gov/airquality or https://cesh.bard.edu/kingston-air-quality-initiative-kaqi/
Post Date: 04-07-2022
